Poverty in Japan: A Simple Look at the Data

15 May 2024
Previously I wrote about the ‘Structure of Modern Japanese Capitalism’ and its future. In that article I analyzed some of the historical background to poverty in Japan in the modern era. I have also highlighted some of the effects of neoliberalism from the 1980s in Japan in video lectures and, more recently, looked at the damaging effects of Japan’s Covid policies on the working class. My argument has been simply that poverty and inequality have been consistent features of Japanese capitalism and have increased since the 1980s.
Yet I have also been criticized for not yet demonstrably proving how Japan is ‘objectively’ ‘poor’ with empirical data and on a global scale. Part of this criticism is I believe unfounded since historical facts and data are objectively empirical. The crises of neoliberalism and Covid also were also pivotal junctures which exposed the inherent vulnerability of the Japanese working class. At the same time there is always room for further demonstration. So, it is my intent in this article, a continuation of the ‘Structure of Modern Japanese Capitalism’, to continue to reveal the ongoing state of poverty in Japan, in this case with a focus on sociological macro trends and giving greater weight to the global context.
What is ‘poverty’?
The historical fact of poverty in Japan is well-documented and undisputed among scholars [1]. Japanese workers for instance earned a fraction of their pre-war counterparts in similar industries in comparable nations in the prewar period and the same holds true for Japan today among OECD nations. Similarly it is generally accepted that poverty and inequality have risen from the 1980s as a result largely of neoliberal reforms including the shift to forms of ‘flexible’ and ‘precarious’ part-time labor [2].At the same time there continues to be confusion regarding poverty in Japan especially among foreign commentators and in the media. Some of this misunderstanding may stem from the terms ‘poor’ and ‘poverty’ which, in the absence of objective empirical data, are open to some interpretation. Therefore it is necessary first to begin from a clear definition of ‘poverty’.
Depending on how one looks at it there are either many or no good ways to measure poverty. This is because of course it contains not only relative and absolute aspects but also normative standards. It is possible of course for someone to be ‘poor in spirit’ but materially rich or vice versa. As economists and not theologians we are concerned mostly with the material aspects. But it should not be forgotten that material poverty itself causes or exacerbates other social problems which can be measured including crime, mental and physical health issues, family and community dissolution and so forth. Similarly, one could be living in ‘absolute’ poverty (>$2.15/day) yet not feel its full effects on a ‘relative’ level if living standards (commodity prices included) in that area are concurrently low. In addition there are a host of other ‘measures’ of society poverty including various national and international ‘poverty lines’, the Gini Coefficient, per capita GDP and so on.
Then there is the problem of wealth stratification or inequality. If some people or groups in society hold the majority of national wealth and income while the rest of the populace holds almost none, i.e. if society is very unequal, then simple medians such as per capita GDP will not tell us very much. Similarly if living standards, wages, or incomes throughout society are low then relative standards also lose much of their meaning. This is to say nothing of the causes of poverty itself for which many more theories abound. Since I have already partly analyzed this in other essays, including the counterpart to this one, I will skip this here. Suffice to say that poverty and riches are two sides of the same coin. There are poor people because there are rich people. And since the two tend to be in exactly inverse proportion, issues of (in)equality are very much relevant to the discussion.
To simplify these issues therefore in this article I will focus on two very simple methods to calculate ‘poverty’. The first relates to ‘relative’ and ‘absolute’ poverty. ‘Relative poverty’ is generally when one’s income falls below half the median income of the society while ‘absolute poverty’ is a complete inability to meet basic needs. Absolute poverty is generally the most visible and it is clearly important. We can consider most issues of homelessness for instance to fall within this category. But too much focus on the extremes can lead us away from the larger picture. Therefore we are mostly concerned with ‘relative poverty’. In this regard there are again two types of ‘relative poverty’. The first deals with poverty within that given society, i.e. in this case Japan. For this we need only to deduce half of the median income, then gauge the percent of population below this level. Yet this too is not the whole picture. So what if we can buy a Mac and Cheese at our prices when we’d need double or triple the amount to do so elsewhere. Thus there is a second relative aspect which is how far one’s income or purchasing power extends outside of that society, i.e. globally. Therefore below I will simply calculate both of these ‘relative’ methods of poverty.
The second overall method relates to inequality. Here I will refer to the methods and findings of Thomas Pikkety and the World Inequality Database which are deemed to be the best and most accurate. This method analyzes the distribution of national wealth (income and capital) by percentile and especially compares the amount of national wealth held by the top decile (10%) to the bottom half (50%). This differs from statistical methods such as the Gini coefficient for instance which tend to equalize or ‘naturalize the distribution of wealth’ [3].
Poverty and inequality in Japan
Let’s begin by looking at the first type of ‘relative’ poverty in Japan, or the percent of the population living below half of the median income. It should be noted even prior to this that incomes and wages in Japan in general are low by both national and international standards. Japan ranked 26th out of 37 OECD countries, between Poland and Spain, according to the latest 2024 OECD data. Thus many or most Japanese workers are ‘relatively’ poor in a global sense, while there is a further stratum of relative poverty in a national sense as well. According to 2021 Ministry of Health, Labour and Welfare data 15.4% of Japanese were living on less than half the median income (post-tax). This was a rise of 1.9% over the past thirty years and higher than the United States at 15.1%. Put differently this means that one in seven Japanese workers lives in relative poverty [4].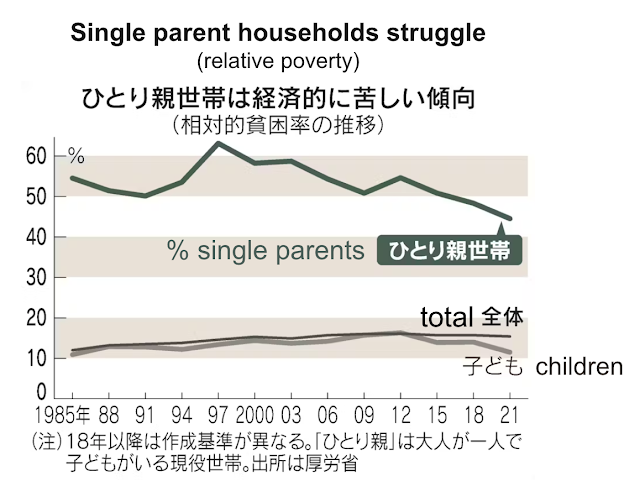
Fig. 1: Percent of total, children, and single parent households living in relative poverty in Japan; Graph from the Nikkei Shinbun
However as noted the average Japanese is even poorer on a ‘relative’ global scale. The OECD reports Japan’s net adjusted disposable household income at $28,872 which ranks 20th out of 40 countries and is below the average of $30,490. The same data ranks Japan 28th of 35 countries for overall social inequality.
This generally corresponds with my own casual data analysis. Japan’s National Tax Agency reports median Japanese earnings at ¥4.58 million or approximately $29,316 (A) (5.2.2024). Meanwhile the US Census Bureau reports median American pre-tax earnings at approximately $47,045 (B). This means that Japanese purchasing power, (A)/(B), in USD terms is just 62%.
This gives some picture of overall ‘relative’ poverty. Let us now turn to the second issue of inequality. This will also be further explored in the following section. But for our current purpose let’s examine data from the World Inequality Database (WID) which breaks down total national income and wealth by ownership.
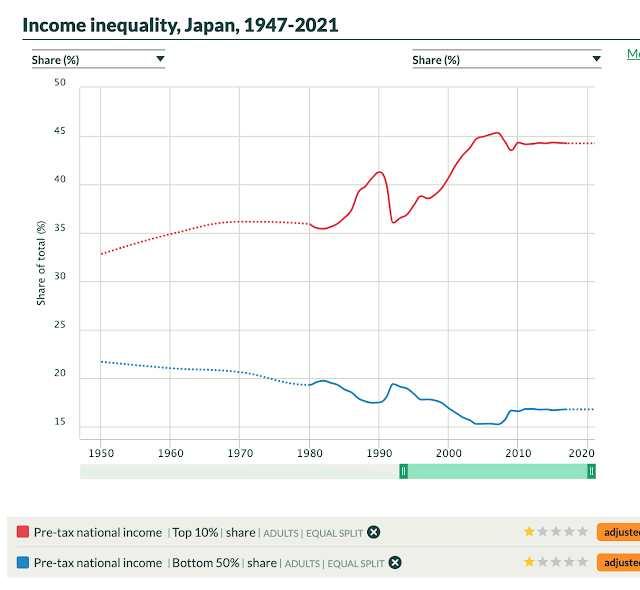
Fig. 2: Income Inequality in Japan, 1947-2021 from the WID
But how does Japan compare on a global level? Surely it is at least ‘more equal’ than other developed capitalist countries? In fact the answer is mostly negative. The graph below shows the same measurement of inequality, wealth ownership of the top decile, on a global scale among six other nations as well as the global average.
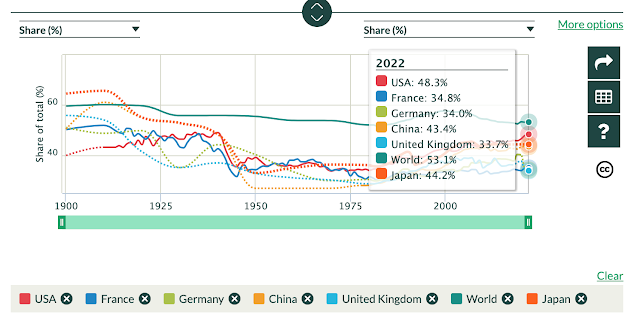
Fig. 3: Top decile’s share of total national wealth from the WID
We can see that at 44% Japan ranks second worst out of the six nations, just four points behind the United States but still below the global average. In other words, there is thus no reason to assume that Japan is ‘more equal’ than other global capitalist nations. In most cases, rather, it is less equal. Neither it is a dramatic improvement over the United States which many commentators love to point to as a negative example.
The picture of relative global poverty can also be measured in purchasing power parity (PPP) between countries. The Economist’s Big Mac Index for instance compares the price of a Big Mac in various countries with the actual exchange rate and using the US as a base index. It seeks to determine whether a currency is ‘over’ or ‘undervalued’ in comparison with the actual exchange rate. And in this way it clarifies how exchange rates can either further boost or restrict a currencies’ purchasing power based on an examination of the actual goods it can buy. With a Big Mac costing ¥450 vs $5.69 in the US, the index finds that the yen is undervalued a whopping 46.5% (5.2.2024) to the dollar in real purchasing terms. This places Japan at 45th on the list behind Pakistan and Thailand and just before Vietnam.
As Professor Emeritus at Hitotsubashi University, Noguchi Yukio, pointed out, the Big Mac Index shows a countries’ overall poverty level, with wealthy countries at the top and poorer developing nations at the bottom. Japan ranks 11th worst out of 54 countries indicating that ‘Japan is poor’ and that its decline from previous years shows that it’s getting ‘even poorer’. Noguchi also pointed out that American wages are 1.76x higher than their Japanese counterparts. Coupled with current exchange rates this makes it nearly impossible for Japanese to buy American goods. Considering such a decline in Japanese real wages and purchasing power, Noguchi concludes that ‘Japanese have gotten poorer’.
Wages and consumption
While declining purchasing power due partly to inflation and exchange or interest rates is one influencing factor, the main cause of Japanese ‘poverty’ stems from low and declining wages. We have already briefly seen how Japan’s wages compare on an overall global scale with other OECD countries. Next we can examine how wages have fallen within Japan over time.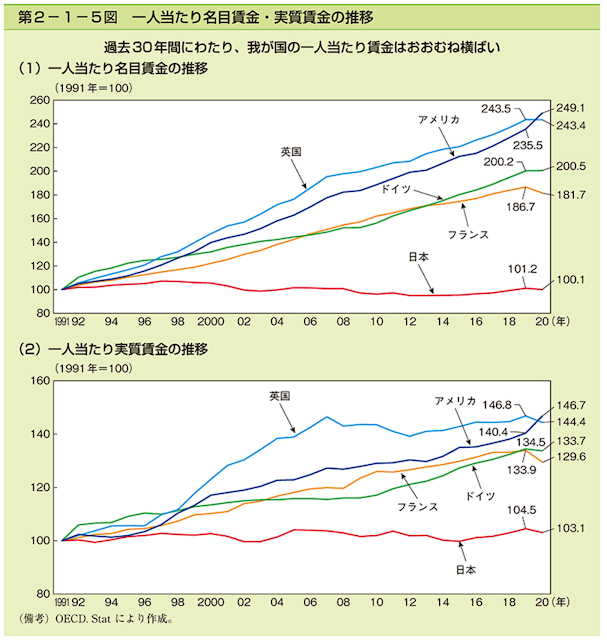
Fig. 4: Real wages by country (Japan in red) since 1991; Cabinet Office Data
Even the most conservative data from the Cabinet Office website shows ‘stagnant’ wages from a 1990 baseline. My own brief analysis of data from the Ministry of Health, Labour and Welfare’s Monthly Labour Survey shows declining wages using 2020 as a baseline index (=100).
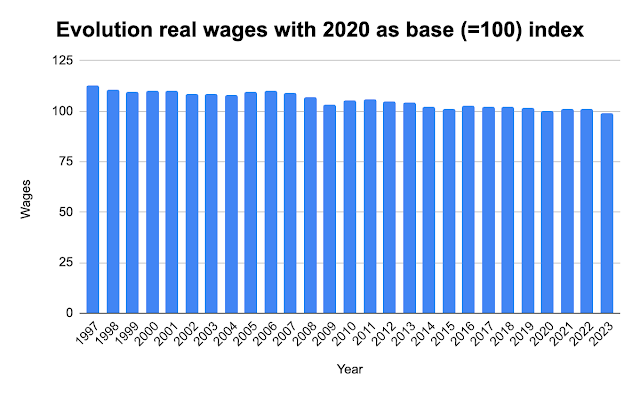
Fig. 5: Evolution of real wages in Japan with 2020 as base index (=100); Author’s graph based on Ministry of Health, Labour and Welfare’s Monthly Labour Survey
Therefore we can unequivocally state that Japanese wages have been ‘stagnant’ or ‘declining’ across the board for decades.
But there are some problems with this too. This is because this only looks at averages and thus some sectors, which are the exception, which are well-paid or maybe even have rising wages could counteract the larger portion of lower-paid industries. Considering the massive rise of part-time ‘flexible’ labor and gig work, which ranges somewhere around 40% of the Japanese workforce, therefore, this is a significant factor. The Cabinet Office for instance estimated that in 2016 full-time workers earned approximately 1.8x more in yearly income than their part-time counterparts. Then there is the important difference between simply low- and high- income earners which is overlooked in national averages. This too is significant. Professor Emeritus at Tsuru University, Gōtō Michio, calculated that the number of people working ‘close’ to the minimum wage (within a range of <1 to <1.3x) in 2020 was nearly 32% of the total workforce, a dramatic rise from 19.5% in 2009.
On top of this, there is a broad disparity among what constitutes a ‘minimum wage’ by region in Japan.
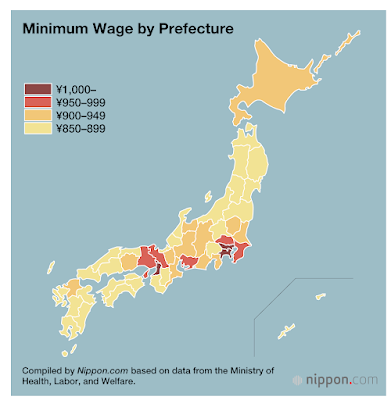
Fig. 6: Disparity in minimum wage by region in Japan; Nippon.com
The above graph from Nippon.com shows variations in the minimum wage by prefecture. The highest minimum wages are in prefectures, most of which are actually just big cities including Tokyo, Yokohama, Nagoya, and Osaka, each of which are slightly above ¥1,000. In contrast, large areas of northeastern Japan, the Tōhoku region, and western and southwest Japan including Kyūshū have minimum wages which range in the ¥850 to ¥899 range. Variations of so-called ‘cost of living’ aside, how much would a person whose sole source of income was a minimum wage job in the Japanese countryside expect to make over the course of a year and in dollar terms? Some very rudimentary calculations help illustrate this.
Suppose that the average minimum-wage worker works eight hours a day, five days a week, four weeks a month. This would yield 160 hrs./mo. which multiplied by twelve months would be 1,920hrs./yr. Incidentally, the ‘average’ hours worked for Japanese workers are by some accounts approximately 1,903 hrs./yr. so we can say that for now these calculations are roughly correct. Furthermore if we are even more generous we can subtract for all the major holidays in Japan including three days over New Years, seven over Obon, and four over Golden Week for a total of fourteen extra days. Note we have already assumed that Saturdays and Sundays are not work days, even though for many minimum wage workers they probably are. In any case, we are now left with 1,808hrs./yr. Next, let’s multiply this with a ‘medium range’ minimum wage of ¥900 yen as would be found in some suburban areas. This equals a yearly income of:
1,808 hrs. x ¥900 = ¥1,627,00/yr.
Moreover, we can divide this back over twelve months to give the amount of ¥135,600. By some calculations, average living expenses for a one-person household are approximately ¥163,781 with the majority of this going to food and rent. This means that our example minimum wage earner would be about ¥28,181 short of the average on his or her expenses per month. We can assume that this would be compensated for via debt/credit or cutting down on expenses.Additionally, ¥1,627,00 in current (2024.5.7) dollar terms is just $10,402. That’s annual income, once again. Since the US poverty line for annual income for one person is $12,880, this means that in USD terms the majority of Japanese minimum wage earners are likely living below the US poverty line.
There is one other indicator we can look at which extrapolates on wages. This is labor’s total share of national income, or in simple terms total employee compensation as a percent of GDP. FRED Economic Data shows that labor’s share of income has fallen from a peak of 62% in 1983 to 56% in 2019. For comparison, the fall began earlier in the United States from a peak of about 65% in 1970 to about 60% today. So we can say that the declining wealth of the Japanese working class has been more significant than in America in this regard.
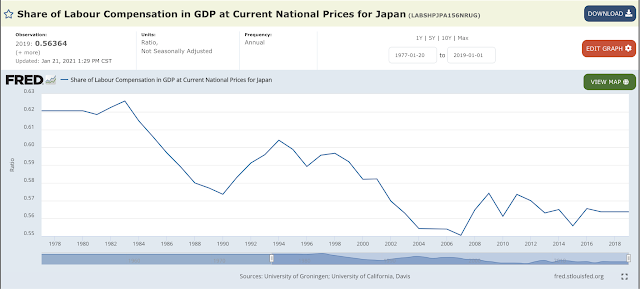
Fig. 7: Labor’s share of national income (GDP) in Japan
In any case, we have seen now that the root cause of much poverty in Japan is low wages. Or, put differently, the low cost of labor. But this just prompts a further question: what is the cause of low wages? And to answer this, we must look again at the structure of Japanese capitalism as outlined in my previous accompanying essay. To summarize from that article, the main reason lies in the ‘Japanese model of profit-making’. This holds basically that Japan is fundamentally an export-oriented economy dominated by large companies which import cheap raw materials, manufacture them in Japan cheaply by depressing labor costs, and selling the finished goods abroad. Because wages must be kept low in this model it follows that domestic demand will also remain depressed. And indeed this is fundamentally the case [5]. This scenario creates a negative feedback loop where Japanese consumers lack the purchasing power to buy back many of the goods that they produce and instead must rely on even cheaper imported products thus explaining the prevalence of 100-yen shops and the decades-long rise in processed-food consumption and so forth. Of course there are exceptions to this ‘rule’ and other influencing factors, too. But this is the main one I’ve focused on here for simplicity.
The decline and overall low level of Japanese consumer spending is well documented and easily verifiable. The Statistics Bureau data confirms firstly that the CPI in Japan has steadily risen for the past decade with a dramatic increase from around 2021.
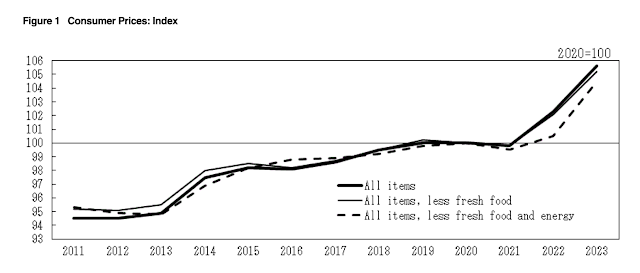
Fig. 8: Rising CPI in Japan
Coupled with low and declining wages as we have already seen this fosters the perfect scenario for reduced demand and spending. And indeed this is the case. The Statistics Bureau again confirms negative growth rates and a declining trend in consumer spending.
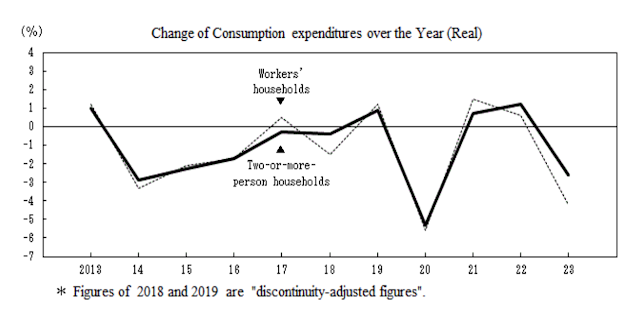
Fig. 9: Falling Japanese Consumer Spending
Conclusion
This essay showed in simple and comparative macroeconomic data how poverty and inequality in Japan have increased as a result mainly of stagnant or declining wages and the waning power of the Japanese working class overall. The essay is meant to complement my earlier article on the Structure of Japanese Capitalism. To be honest I am typically skeptical of the very data such as that I have used here since it can often be skewed to show different things and because such numbers frequently obscure more important realities behind what has been called the ‘tyranny of metrics’. This is why I am mostly interested in historical analysis which in my view better illustrates cause and effect. Moreover, what is clearly missing in this data are accounts of actual average working Japanese people and those struggling with poverty. To really understand poverty in Japan, such qualitative analysis is crucial. While I partly attempted this in an earlier essay on the destructive effects of Japan’s Covid policies, this still barely even begins to scratch the surface. Another necessary area of investigation is a more detailed look at how the economic situation varies across the prefectural or regional level. I hope to tackle both of these issues further in future articles.Additional notes
[1] See for instance Hane 1982, Minami 2008, Tachibanaki and Urakawa 2008, Huffman 2018, Inoue 2018, Shiomi 2021, Kurokawa 2022[2] Sekine 2008, Inoue 2018
[3] Piketty 2014: 270
[4] See also Tachibanaki and Urakawa who calculated the poverty line at ‘50% of the median value of equivalent disposable income’ and found that ‘one in six households is on or below the poverty line in present-day Japanese society’ (2008: 29).
[4] See also Tachibanaki and Urakawa who calculated the poverty line at ‘50% of the median value of equivalent disposable income’ and found that ‘one in six households is on or below the poverty line in present-day Japanese society’ (2008: 29).
[5] Tomioka 2014: 119
